|
|
|
|
|
Home
 Return
to the GraFit home page
Return
to the GraFit home page
Product Info
 Get information about the GraFit program
Technical Support
 Get technical support information about the GraFit program
Purchase
 Get information about purchasing GraFit software licenses
Download GraFit
 Download the GraFit program and program updates
Search
 Search the GraFit web site
Site map
 View the structure of the GraFit web site
About
 Get information about Erithacus Software
|
|
|
|
|
|
|||||||||||||||||||||||||||
|
Home |
Technical |
Sales |
Web Site |
|||||||||||||||||||||||||||||
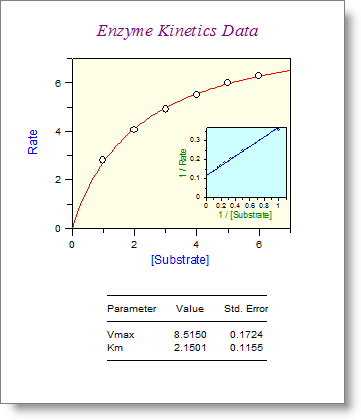
To illustrate some of the power of GraFit, we have used the analysis of a set of enzyme kinetic data as an example. The following data need to be fitted to the standard Michaelis Menten enzyme kinetic equation, and a plot made of the raw Rate versus [Substrate] data and also a Lineweaver Burk plot made of these data.
|
 |
|
Terms of Use •
Privacy Policy •
Contact Us |
|
|
|
|
|


 Search
  Site map
  About
About  Go to the tutorials